AT 309 Week 12 - Processing Data with Drone2Map
In this weeks lab, we learned the process of processing data in the Drone2Map software. This software is ESRI's equivalent of Pix4D, designed to integrate into the rest of the ArcGIS Suite.
The processing generates 5 outputs: a true ortho (figure 1), a digital surface model (DSM) (figure 2) and DSM shaded relief (figure 3), and digital terrain model (DTM) (figure 4) and DTM shaded relief (figure 5). It also shows the flight line and image centers of the flight, with an orange line and blue dots respectively.


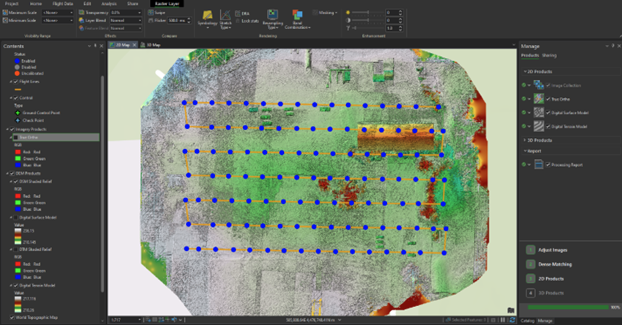


We made 3 maps with the data we processed.
Shaded DTM with transparent DTM on top (Figure 6)
Shaded DSM with transparent DSM on top (Figure 7)
Orthomosaic Map (Figure 8)
The DSM and DSM Shaded Relief show elevation values including objects in the area like cars, buildings, and trees. The DTM and DTM Shaded relief shows only ground elevations, omitting objects in the area like cars, buildings, and trees. The value in DSM/DTM assigns a color spectrum to elevation values, essentially color coding items of different elevation and changes in it (in my case, it shows a range from about 210 to 236 meters).


Comments