AT 319 Week 5 - Geospatial Data Sources
johnpkeough
May 7, 2025
1 min read
This weeks lab covers the process of gathering geospatial data from public sources and using it to perform analysis in ArcGIS Pro. In terms of the deliverables, I was asked to make:
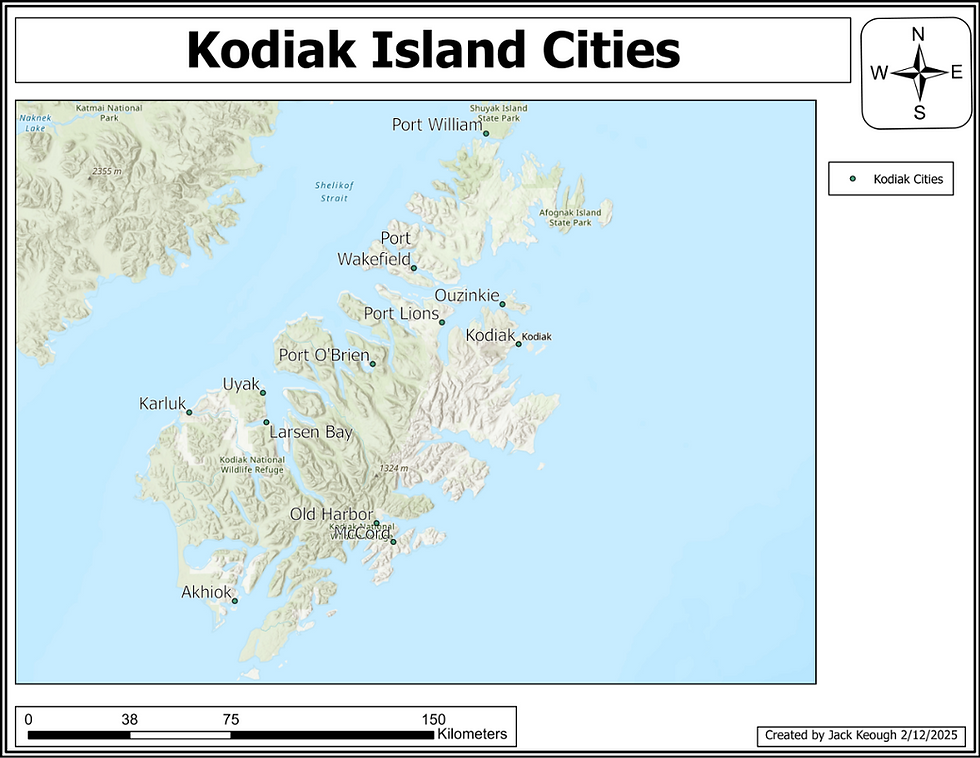
A Kodiak Island Map (Figure 1)
Population Density Map (Figure 2)
A proportional Symbol Map (Figure 3)
Shaded Relief/Hydrography Map (Figure 4)
Map of wetlands by size and class (Figure 5)


Comments